A lithium polymer cell from BAK battery was cycled on channel one of the PCBA 5010-4 battery analyzer consisting of a standard cobalt oxide cathode and carbon anode in a pouch enclosed flat prismatic shape with nominal voltage of 3.6V and 2,800 mAhr rated capacity.
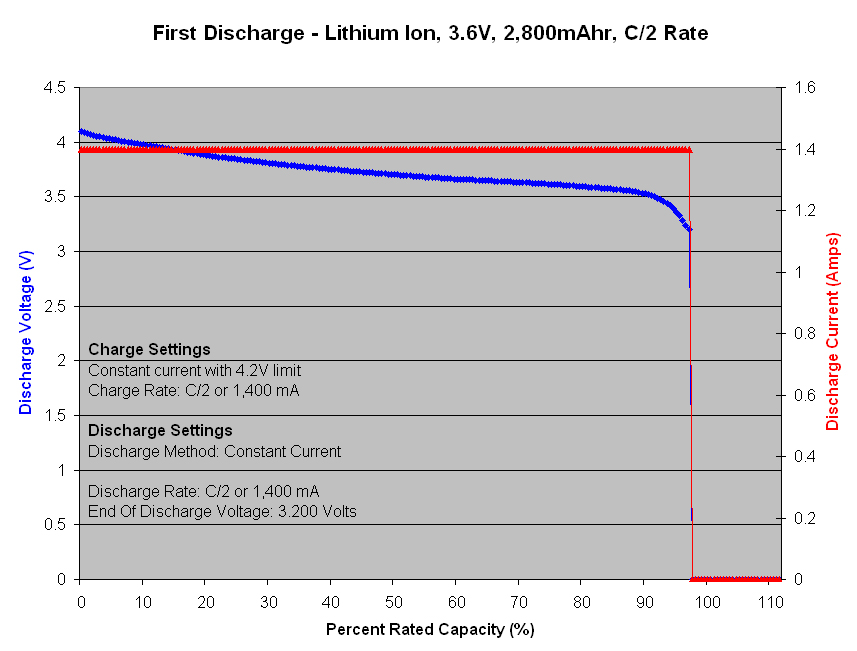
Figure 1 – Initial capacity test at C/2 rate
First discharge cycle of new cell achieved 97.3% of rated capacity at C/2 rate with a strong voltage profile holding-up between 4.2V to 3.5V for first 90% of discharge and then fell-off quickly toward 3V over last 7% of discharge.
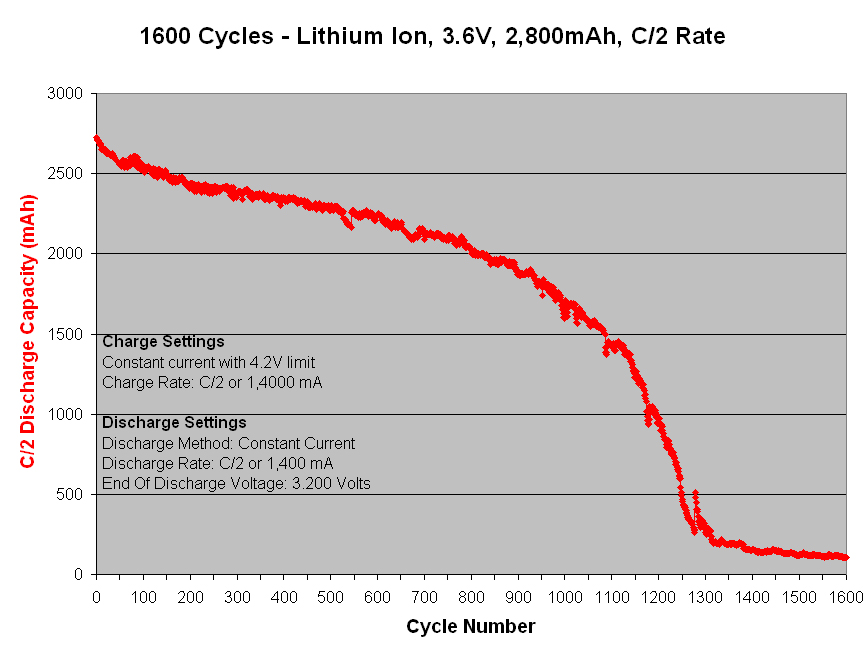
Figure 2 – Life cycle result at C/2 rate
Capacity faded quickly during the first 50 cycles and then more slowly thereafter for next 500 cycles. From cycle 550 to 1000 capacity fade started to increase more quickly again and worsened severely between cycle 1000 to 1200 where capacity fell-off toward only 10% of its initial value indicating a serious problem with the cell’s ability to function usefully.
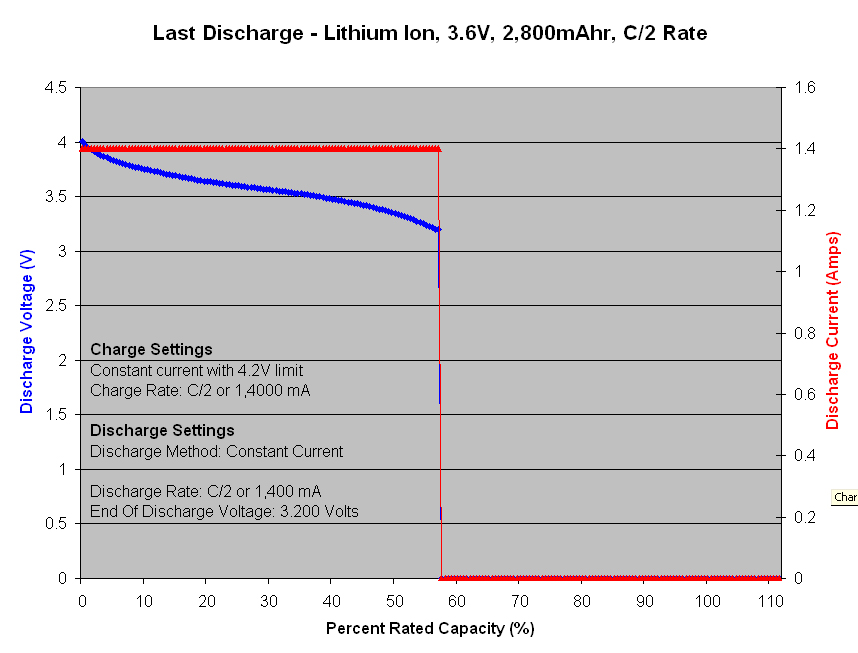
Figure 3 – Final capacity at C/2 rate after 1,000 cycles
The final voltage profile after 1,000 cycles shows a lower level voltage offset indicating an increase of internal resistance when compared to cycle number one and also shows a steeper declining voltage slope indicating worsened kinetics and structural changes of active materials.
Overall, the results are as expected except for the rapid decrease in capacity over the 1000th cycle which was a little surprising. I suspect that there may have been a structural change due to pulverization of the cathode material that may have then in turn contaminate the cell’s electrolyte or possibly locked-up active lithium into irreversible bonds which then hastened the capacity decline.
Copy of Excel file for this report can be downloaded here, Lithium Ion Battery Analyzer Life Cycle Test.xls


