Archive for the ‘Education’ Category

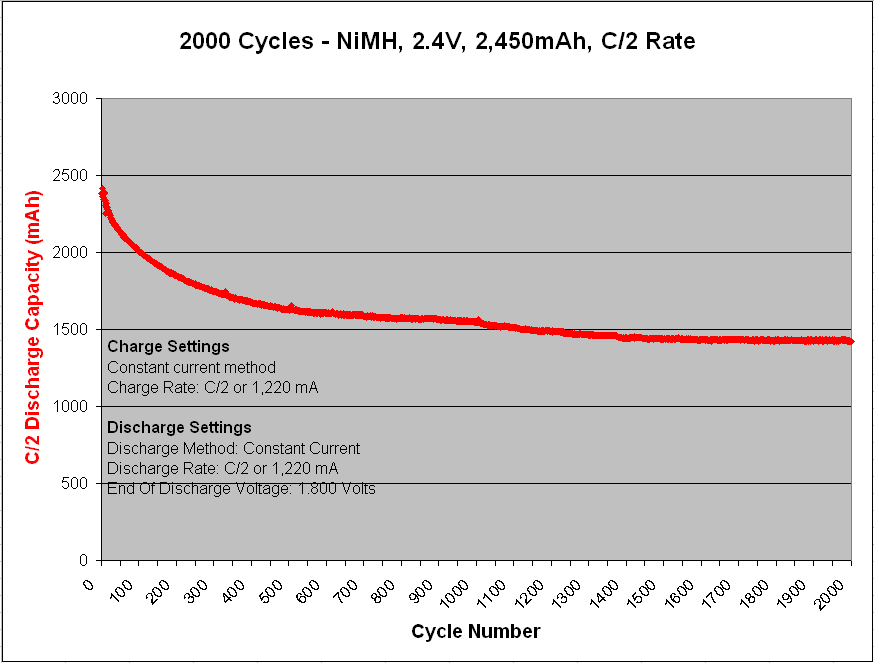
NiMH 2000 Cycles

Tuesday, April 22nd, 2014

Comments recently asking how the NiMH chemistry fared beyond the first 1000 cycles in the battery life cycle test was a question i asked myself back in the day as well, so a second set of 1000 cycles were run but results were not posted til now.

After a second 1000 cycles the NiMH capacity faded an additional 5%, dropping to 58% of rated capacity from 63% after the first 1000 cycles.

The NiMH chemistry held up well in terms of cycle life when not abused or over-heated by the charger which in-practice can be a difficult thing to do with NiMH battery types due to difficulty at detecting and terminating a full charge correctly and preventing damage from over-heating, especially at faster charge rates such as C/2 and without the use of a temperature sensor.

The PCBA 5010-4 battery analyzer uses a custom ‘voltage only’ method of full-charge termination with multiple redundant detection methods for NiMH and NiCd chemistry types developed over ~15 years which now demonstrates its effectiveness in life cycle testing by not overheating the cells or causing venting of electrolyte and capacity loss other than by what seems to be normal loss as a function of normal use.

Lithium ion failure

Friday, April 4th, 2014

A good explanation of why lithium ion batteries lose capacity over their cycle life is that components of the electrolyte oxidize at the cathode under high voltage and high temperature conditions which then are reduced at the anode side and eventually block-off the porosity and ionic conduction deeper into the anode material which then results in lithium metal plating and shutting down of the cell.

This seems a more likely cause and effect than my explanation for the lithium ion lifecycle test below thinking the failure was due to pulverization of the cathode material since that would in turn cause oxygen release and gassing into a puffy cell which did not happen, so i think electrolyte reduction and coating on the anode would better explain the sudden loss of capacity.

A very interesting theory and technique for measurement of electrolyte degradation are explained in the video below by Jeff Dahn of Dalhousie University.

Why do Li-ion Batteries die ? and how to improve the situation?

Professor Jeff Dahn (Dalhousie University)
  • CC

Lithium Ion – Life Cycle Test

Tuesday, July 30th, 2013

A lithium polymer cell from BAK battery was cycled on channel one of the PCBA 5010-4 battery analyzer consisting of a standard cobalt oxide cathode and carbon anode in a pouch enclosed flat prismatic shape with nominal voltage of 3.6V and 2,800 mAhr rated capacity.

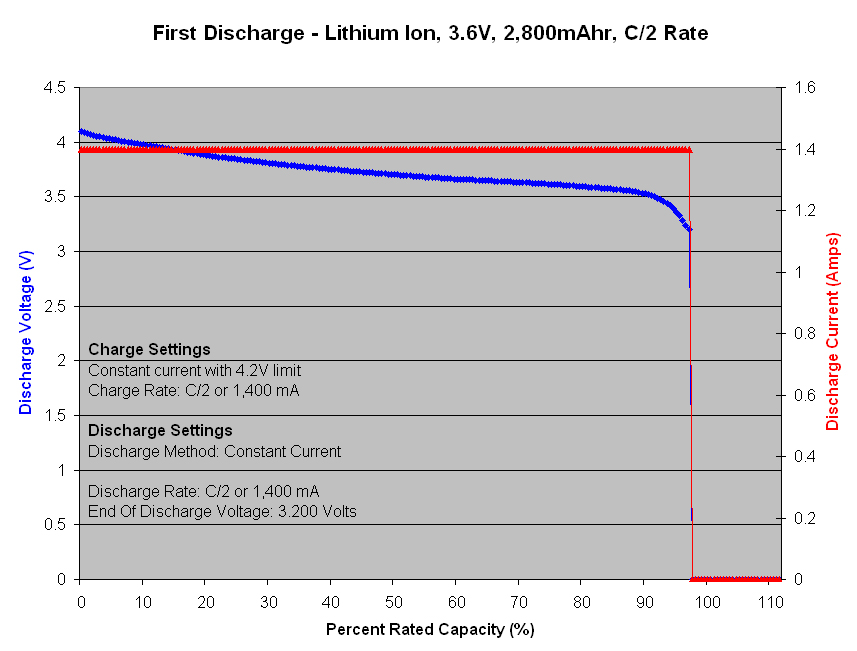
Figure 1 – Initial capacity test at C/2 rate

First discharge cycle of new cell achieved 97.3% of rated capacity at C/2 rate with a strong voltage profile holding-up between 4.2V to 3.5V for first 90% of discharge and then fell-off quickly toward 3V over last 7% of discharge.

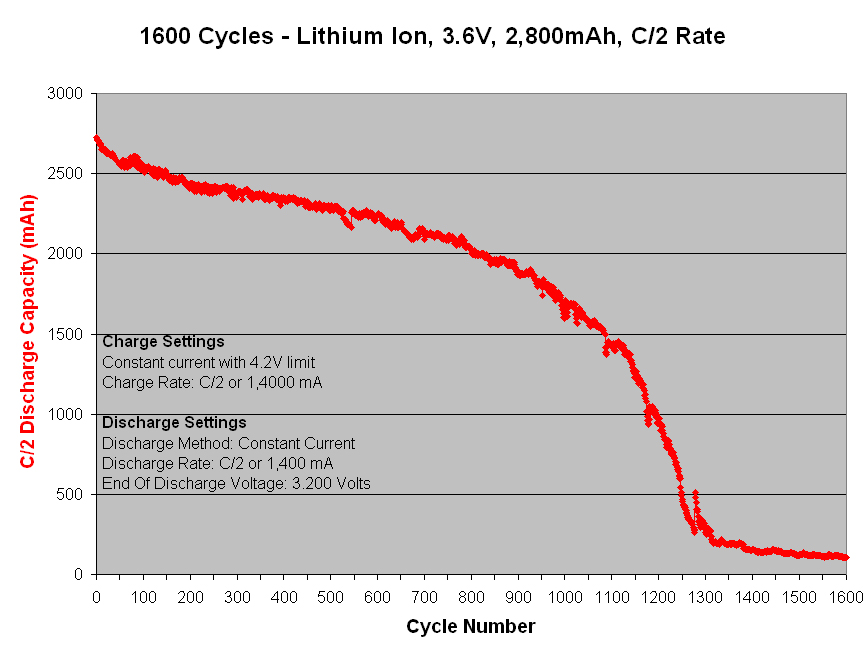
Figure 2 – Life cycle result at C/2 rate

Capacity faded quickly during the first 50 cycles and then more slowly thereafter for next 500 cycles. From cycle 550 to 1000 capacity fade started to increase more quickly again and worsened severely between cycle 1000 to 1200 where capacity fell-off toward only 10% of its initial value indicating a serious problem with the cell’s ability to function usefully.

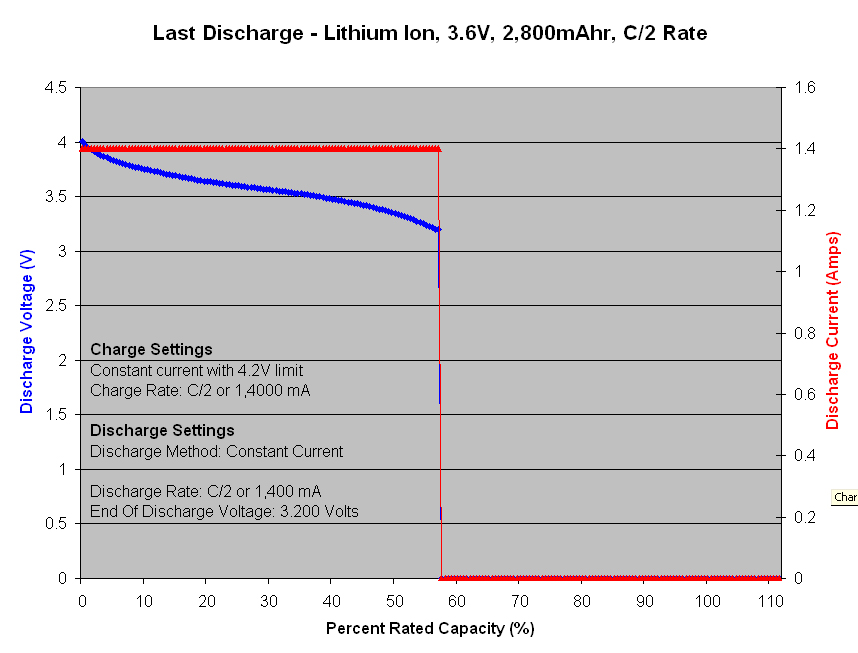
Figure 3 – Final capacity at C/2 rate after 1,000 cycles

The final voltage profile after 1,000 cycles shows a lower level voltage offset indicating an increase of internal resistance when compared to cycle number one and also shows a steeper declining voltage slope indicating worsened kinetics and structural changes of active materials.

Overall, the results are as expected except for the rapid decrease in capacity over the 1000th cycle which was a little surprising. I suspect that there may have been a structural change due to pulverization of the cathode material that may have then in turn contaminate the cell’s electrolyte or possibly locked-up active lithium into irreversible bonds which then hastened the capacity decline.

Copy of Excel file for this report can be downloaded here, Lithium Ion Battery Analyzer Life Cycle Test.xls

Nickel Metal Hydride – Life Cycle Test

Wednesday, February 29th, 2012

Cycled on channel three of the PCBA 5010-4 battery tester were a pair of series connected Nickel Metal Hydride cells from Sanyo, part number HR-AU, that gave a nominal battery voltage of 2.4 Volts and a typical capacity rating of 2,700 mAh at the C/5 discharge rate with a minimum capacity rating of 2,450 mAh according to the manufacture’s datasheet. However, during the very first discharge cycle of the Prime function, the highest capacity achieved (at the C/2 discharge rate) was only 2,460 mAh or 100.4% of the minimum rated capacity. At a lower C/5 discharge rate the battery’s capacity would have probably achieved a few percentage points higher, closer to the 2,700 mAh manufacture’s rating. Regardless, the capacity quickly fades by 13% after only 50 cycles such that by discharge number 50, at the C/2 rate, the capacity falls to 2,131 mAh or 87.0% of the minimum 2,450 mAh rating.

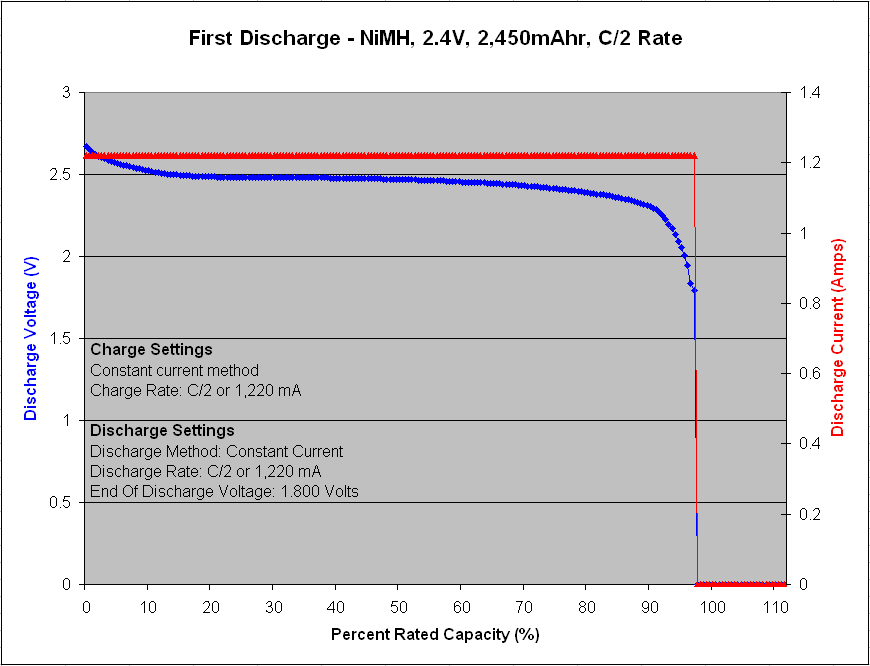
Figure 1 – Initial capacity test at C/2 rate

Following a few initial prime cycles on the pair of brand new cells, Figure 1 shows the first discharge capacity and voltage profile result of the life cycle test. The capacity is seen to be 2,381 mAh or 97.2% of the 2,450 mAh minimum rating and the voltage holds fairly flat above 2.4 Volts for most of the curve.

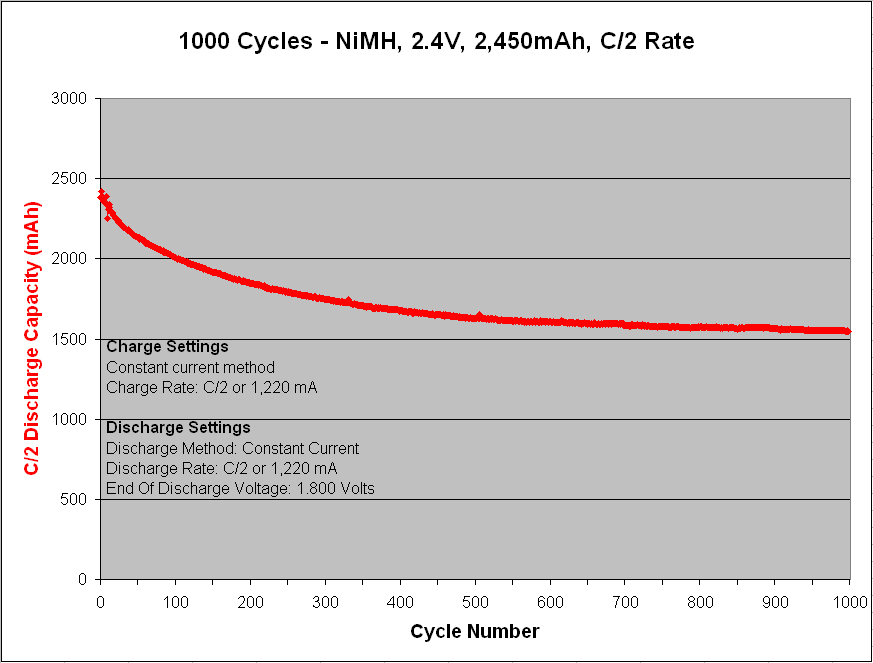
Figure 2 – Life cycle test results at C/2 rate

After 200 cycles at 100% depth of discharge (DoD) the capacity fades to 1,838 mAh or 75.0% of the 2,450 mAh rating. After 500 cycles the capacity drops further to 66.6%, and after 1,000 cycles, the capacity remaining is only 63.1%. Overall, the performance is as expected and actually quite good

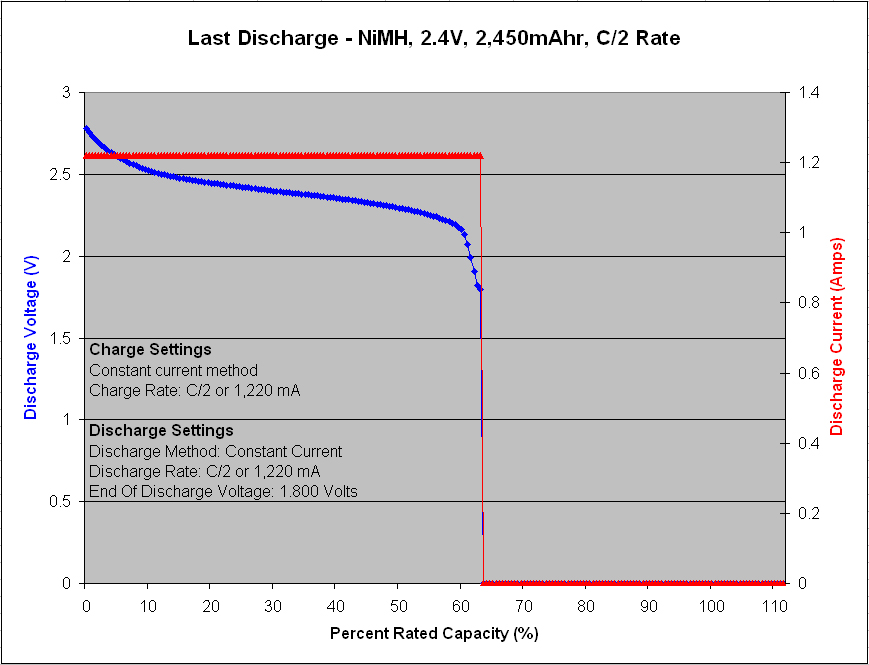
Figure 3 – Final capacity at C/2 rate after 1,000 cycles

The final discharge capacity after 1,000 cycles was only 63.1% with a fairly sloped voltage profile.

The life cycle test results were overall quite good. To reach 1,000 cycles at 100% DoD and still have over 60% capacity remaining is not bad. With only two cells in series it’s very easy to keep the two cells balanced such that neither cell is subject to abuse. Problems often arise in higher voltage NiMH battery packs when numerous cells are connected in series to obtain higher nominal voltage. It often leads to a cell imbalance problem where the lowest capacity cell begins to suffer the deepest discharge stresses and poorer charge acceptance that can rapidly degrade the cell’s capacity and quickly limit the overall cyclic performance and capacity of the pack.

Another reason for the good results is likely the quality of the charger and the algorithm used for full charge detection without overcharge in the PCBA 5010-4 battery analyzer. Also, a very important factor with NiMH batteries is the physical arrangement of the cells within the pack for thermal reasons. I’ve seen many packs over the years with multiple cells connect in parallel or series – often bundled in a spiral arrangement – to increase the capacity and voltage of the pack. The result is cells wrapped in cells with little surface area for removal of heat. Problems then arise during high rate charging because NiMH cells are exothermic on charge – meaning they give off heat – possibly resulting in a significant temperature rise affecting the pack’s voltage enough to make full charge detection by voltage only methods very difficult. Poor full charge detection then results in frequent overcharging and excessive heating of the pack which shortens cell life. The overheating is especially troublesome for cells packed in the middle of the battery where the temperature rise can be most significant; leading to cell imbalance problems once again, rapidly degrading the whole pack.

Sealed Lead Acid – Life Cycle Test

Friday, November 25th, 2011

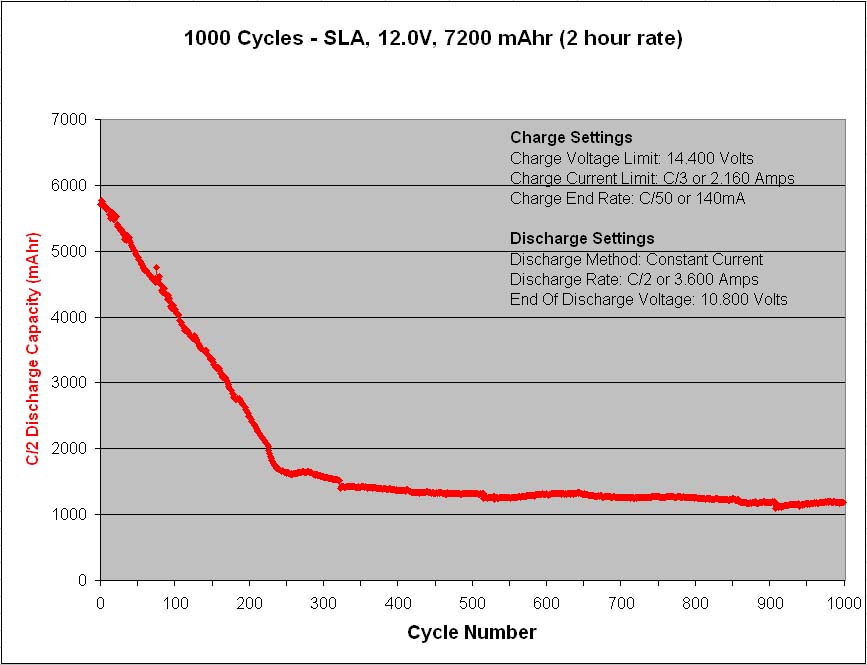
This post and the next three to follow will examine the life cycle test results of the four most common battery chemistries in use today; a sealed lead acid, a nickel metal hydride, a nickel cadmium and a lithium-ion polymer; using a PCBA 5010-4 battery analyzer to perform 1,000 charge/discharge cycles at the C/2 rate. The two-hour discharge rate was chosen to keep the discharge stress fairly low while still providing a brisk pace for achieving a thousand cycles in a reasonable amount of time. The C/2 discharge rate is admittedly fast for a lead acid battery whose capacity is typically rated by the manufacturer at the C/20 rate, this will result in a lower discharge capacity level for the lead acid type, but the idea of this life cycle testing with different chemistries is simply to compare the relative performance of the four most common chemistry types in order to gain a general appreciation for their capabilities and differences.

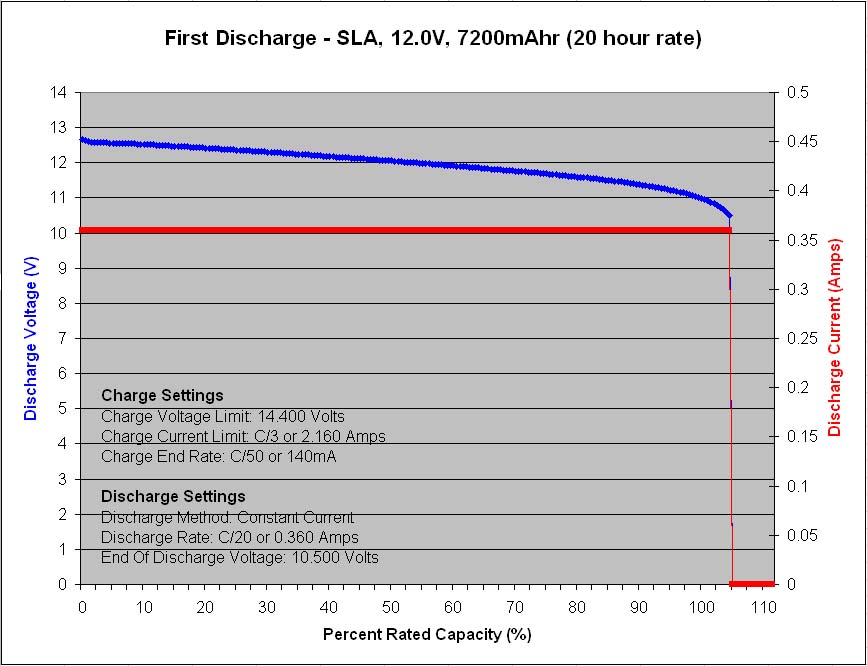
Figure 1 – Initial capacity test at C/20 rate

  The first sample to finish cycling 1,000 cycles was the 12V, 7.2Ah, VRLA battery from Panasonic, model LC-R127R2P1. Prior to the start of life cycle testing, the new battery was tested at the C/20 rate to ensure that  it meets its 7,200 mAh rated capacity, and it did, by achieving 7,555mAh or 105%.

Figure 2 – Life cycle test results at C/2 rate

At the C/2 discharge rate the capacity immediately drops to 5,700mAh and then  steadily declines until reaching 1,650mAh after only 250 cycles, after which time the rapid capacity loss slows and the capacity averages near 1,300mAh for the remaining 750 cycles.

Figure 3 – Final capacity test at C/20 rate

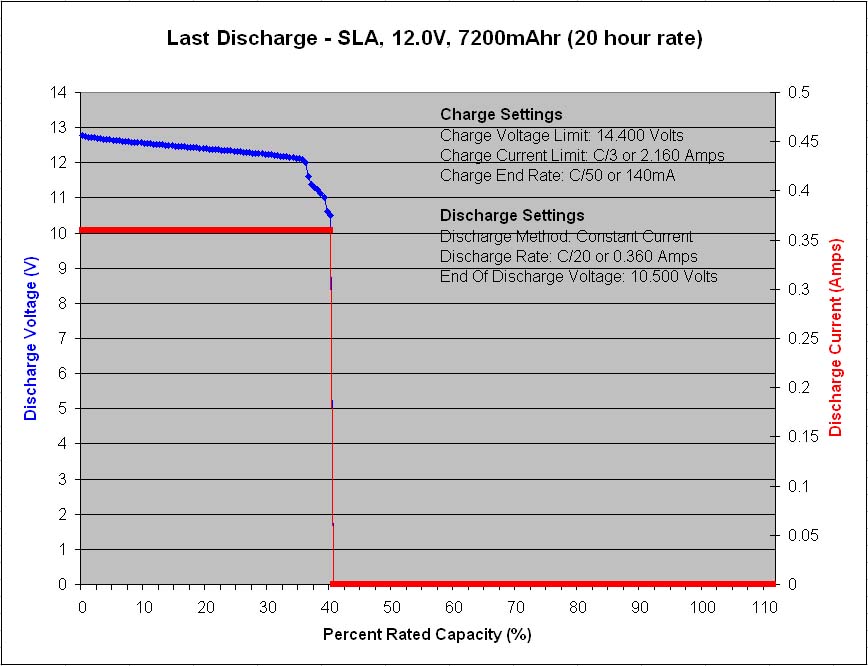
A final discharge test was performed at the C/20 rate once again to see how the battery would perform at the lower discharge current and its tested capacity immediately bounced back to 40% of its rated capacity.

These life cycle test results are interesting with a couple of things worth noting. The first is the rapid capacity decline during the first 250 cycles followed by the slower capacity decline for the remaining 750 cycles. It seems as though there are two different wear mechanisms at work simultaneously, one that deteriorates the battery capacity very rapidly and then exhausts itself, and a second that deteriorates the battery capacity very slowly but endures.

The second item worth noting is the sudden voltage drop near the end of discharge in figure 3, with a small plateau, followed by another quick voltage drop to terminate the discharge. These quick voltage drops are due to lower capacity cells losing their voltage rapidly, unable to maintain their load current at voltage. This indicates a probable cell imbalance issue whereby the lowest capacity cells are not getting the opportunity to fully recharge during the charge portions of the cycling, and in turn are limited in their discharge capacity during the discharge portions of the cycling. A cell imbalance condition may be effected by the heavy cycling demand of the life cycle testing itself which leaves little time for float charging at the end of each charge portion that would normally help to balance the cells connected in series. A cell imbalance problem is typically a self-perpetuating vicious circle and from looking at the discharge voltage profile results during the first 250 cycles (not shown in this post), it can be seen that a rapid voltage drop near the end of each discharge portion starts to appear gradually during the first 250 cycles, so this may in fact be the real reason for the rapid capacity loss during the first 250 cycles, a cell imbalance problem, and not a two stage wear mechanism as was first proposed above.

A possible way to determine if a cell imbalance issue is in fact the main problem causing the rapid capacity loss in the first 250 cycles would be to repeat the life cycle testing once again, but in the second attempt try setting the test configuration to using a higher charge voltage during the charge portions in order to force more capacity into the series connected cells with the intent of providing an increased amount of overcharge to the healthier cells while likewise providing a more complete charge to the lower capacity cells in order to maximize the ability of the cells to work together and prevent a cell imbalance problem from self perpetuating toward rapid capacity loss.

The charge voltage maximum used for the testing in this example was 14.400 Volts and the recommended charge voltage from Panasonic for cyclic applications with this battery is 14.5-14.9 Volts, so in a future life cycle testing I would try using the highest recommended charge voltage at 14.900 Volts to see what improvements can be achieved.

Lithium Polymer Battery

Friday, May 13th, 2011

A lithium polymer battery is still a lithium ion battery except that it uses a solid plastic electrolyte material for ionic conduction between the anode and cathode electrodes rather than a liquid solvent. The solid polymer material still allows for movement of a dissolved lithium salt and ionic conduction between the electrodes while at the same time provides an insulating barrier to electronic conduction and physical separation of the positive and negative electrodes.

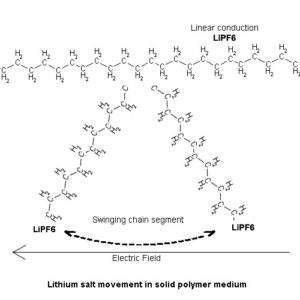
The main difference of a lithium polymer battery is the solid electrolyte’s solid properties and therefore methods by which movement of ionic molecules occurs within the material. There are two ways by which a lithium ion can propagate within the plastic electrolyte medium, one is by linear conduction along the axes of the polymer chains and chain segments, the other is by chain segment motion, bending or swinging action. In either case, the force for the movement results from the electric field interaction that exists between the cell’s electrodes and the charge on the free moving lithium cation.

Advantages of polymer electrolyte cell construction over liquid electrolyte cell construction are first and foremost the solid electrolyte itself is non-volatile and will not leak and therefore is less of a safety hazard in most applications. It can also be pressure laminated between the electrodes to provide a uniform solid mechanical contact between the electrodes that will not shift or move once assembled, in turn allowing for flat planar shaped cell designs and is not limited to cylindrical shaped packaging commonly used for liquid electrolyte systems. A further advantage then becomes the 100% packing factor and volumetric utility achievable with rectangular shaped cells for construction of multi-celled battery packs versus the use of cylindrical shaped cells that are theoretically limited to a volumetric utility of pi/4=78.5%.

Electrovaya – Overcoming the Carbon Conundrum One Step Above the Rest

Monday, August 9th, 2010

United States patent 5721067 titled ‘Rechargeable lithium battery having improved reversible capacity’ represents a significant breakthrough by Electrovaya for dealing with the difficult problem of first charge capacity loss with lithium ion cells using carbon as the active anode material. The irreversible losses of carbon have long plagued the lithium ion battery industry and continue to do so to this day for manufacturers not authorized to use Electrovaya’s exclusive breakthrough technology.

In a traditional lithium ion cell the only source of lithium within the cell upon construction is that which is contained in the cathode material itself such as lithium-cobalt-oxide, lithium-manganese-oxide or lithium-iron-phosphate. These cathode materials are produced in conjunction with lithium containing source ingredients such as lithium carbonate in order to synthesize fully lithiated cathode materials in the discharged state.

The well known and predominant industry challenge of using carbon anode materials is that they irreversibly consume approximately 20% of the lithium received during first charge. Lithium, electrolyte and other additives within the cell are adsorbed during formation of the solid electrolyte interphase layer (SEI) and are locked away in non-active carbon sites reducing the total reversible lithium content of the cell, effecting an immediate and unavoidable increase in mass of under-utilized cathode material, adding to the cell’s cost, size and weight.

Electrovaya’s unique invention allows these irreversible losses to occur with little to no concern for the amount of lithium and electrolyte consumed during the formation process. By adding a novel twist to their manufacturing technique, Electrovaya has placed a significant portion of their formation process ahead of the final assembly stage. The exact nature of their technology is explained in great detail in their patent, but the main focus of the invention lies in the addition of an extra step in the cell’s manufacturing process whereby assembly of the complete cell is performed as usual, minus the aluminum foil current-collector-laminate normally covering the outer cathode surface.

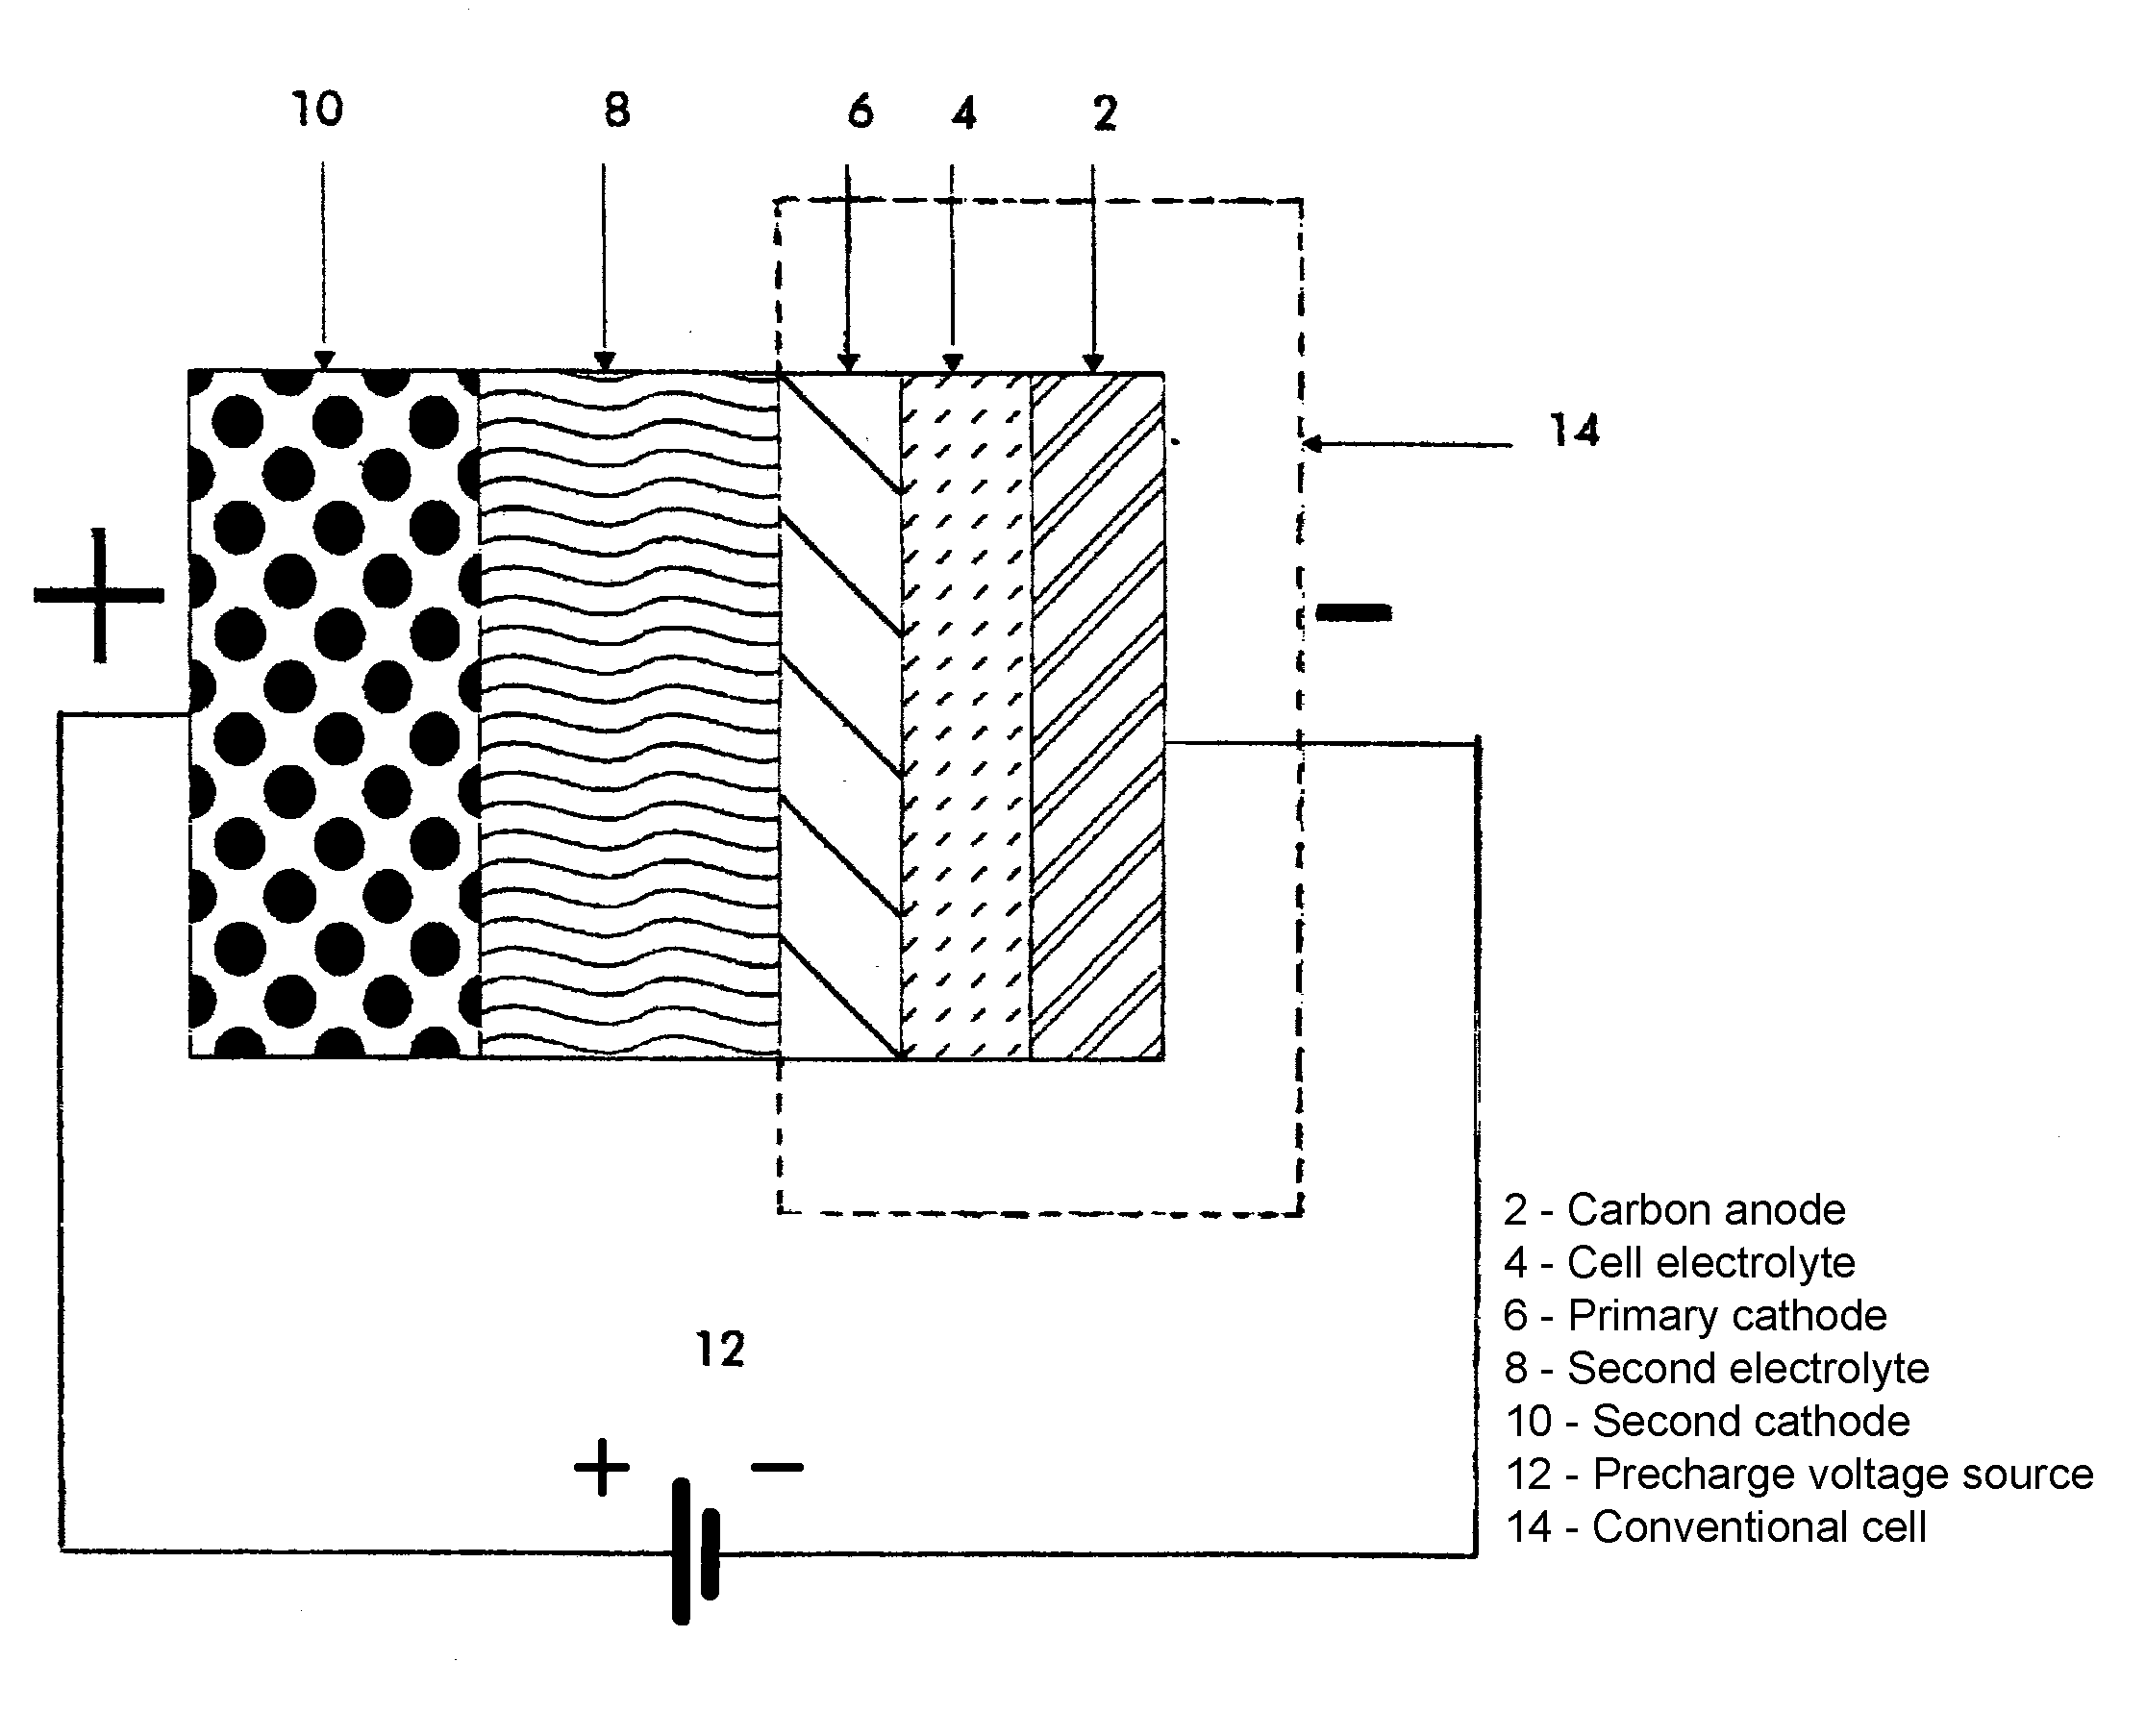
With the outer cathode surface exposed, a secondary lithium containing source (10) is brought into close proximity and ionic contact via a secondary electrolyte (8) with the primary cathode (6). The initial formation process then proceeds by driving lithium ions from the secondary lithium source (10), through the secondary electrolyte (8), primary cathode material (6), across the cell electrolyte (4), and into the carbon anode (2), in order to obtain a partial charging and substantial formation of the SEI layer between the cell electrolyte (4) and carbon anode (2). Once the partial charge is complete, the secondary source of lithium (10) and electrolyte (8) are removed and the traditional aluminum foil current-collector is placed in contact with the outer cathode surface as usual for final cell assembly. After final packaging and sealing the completed cell can then continue with further charging and testing as required.

Development of this innovative pre-charging technique has enabled Electrovaya to shift their focus away from the lithium loss issue more toward the development of substantial SEI layer formation techniques that can be more robust than other manufacturers predominantly occupied by lithium loss issues. Formation of a sound SEI layer is crucial for reliable enduring battery function providing a barrier of separation between the electrolyte and carbon electrode. Once formed, the SEI resists any further interaction between these two phases while facilitating the transport of lithium ions between the carbon electrode which carries only individual Li atoms and the bulk electrolyte which carries larger lithium ion salt molecules such as Lithium Hexafluorophosphate (LiPF6)

Elimination of the inactive cathode-material-content and restrictions on the amount of lithium and electrolyte consumed during formation of the SEI layer presents a significant technological advancement for producing cheaper, smaller, lighter cells with superior SEI layer formations effective for use with all cathode materials commonly used today and new cathode materials in the future.

Lithium Ion Anode Materials – Ordered and Disordered Carbon

Thursday, June 10th, 2010

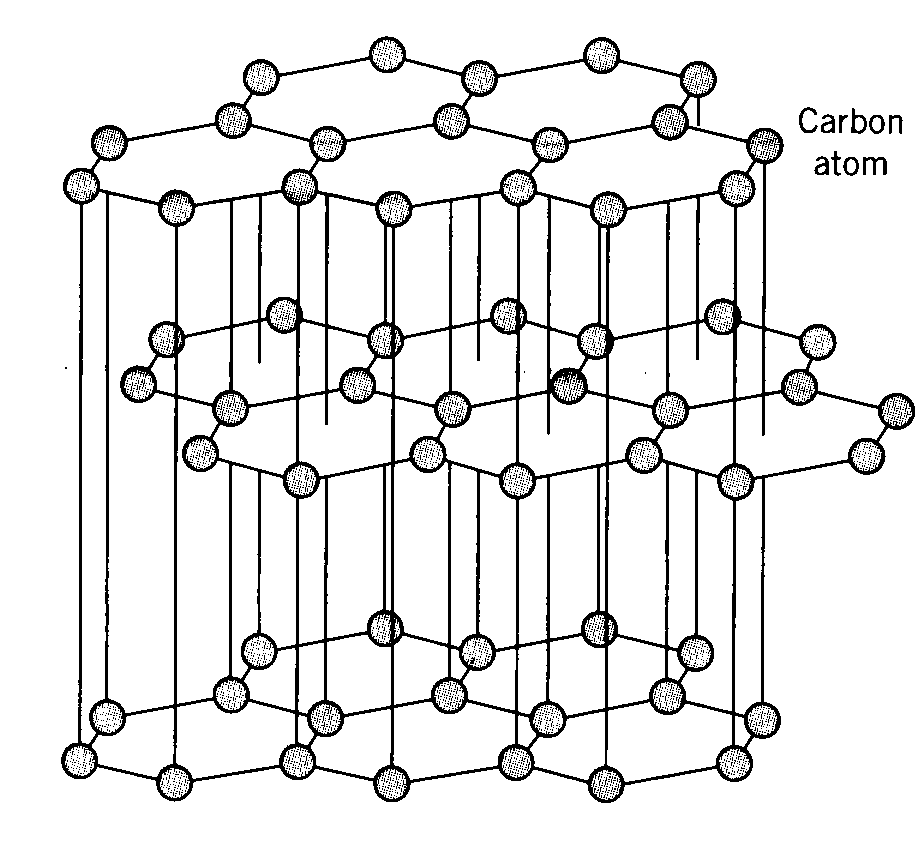
The most common lithium ion anode material used today is carbon in its highly ordered graphite form with a maximum theoretical capacity of 372 mAh/g by the formation of LiC6. Graphite is the most thermodynamically stable form of carbon structure commonly referred to as the standard state where carbon atoms are held together by strong covalent bonding in a hexagonal lattice structure forming expansive sheets or layers loosely coupled together by much weaker van der Waals bonding between layers. The interlayer spacing provided by the weakly bonded graphene is highly accommodating to insertion and extraction of lithium cations. The graphene layers also have excellent electronic conductivity through the tightly bonded carbon planes providing low resistance electron pathways to facilitate easy electron pairing with lithium cations throughout the material. The graphite electrode’s structure is mechanically stable and highly cyclable undergoing very small volume change of only about 10% from fully lithiated to fully de-lithiated and can provide 1000’s of cycles without any appreciable loss of capacity.

Non-graphitic or disordered carbon contains the same covalently bonded hexagonal lattice structures as graphite but in much smaller pieces differing in size and orientation such that there’s no consistent expanse of ordered layering, similar to a sheet of tempered glass that’s been shattered into pieces and dumped into a pile. Amazingly, these disordered carbons can exhibit very high reversible capacities in the range of ~400 to ~2000 mAh/g. The exact mechanism for the higher than theoretical capacity over lithiated graphite LiC6 at 372 mAh/g is somewhat controversial but may be due to a collection of factors such as lithium being held in deposits on the carbon’s prismatic surfaces and edges or held in the carbon’s pores and surface defects or held in covalent Li2 formations similar to lithium metal deposits but not quite due to the surrounding carbon. Volume change in disordered carbons is small, less than 10%, due to the soft disordered nature and increased spacing between smaller carbon pieces. Problems with disordered carbons are they can exhibit higher voltage hysteresis than graphite between charge and discharge functions causing lower cyclic efficiency and heating, also their higher capacities are often obtained at only a few milli-Volts above Li+/Li increasing the risk of lithium metal plating and higher irreversible first charge capacity losses compared to graphite.

Overall, lithiated graphite electrodes are fantastic anode materials in lithium ion batteries with amazing abilities for graphene layers to operate super-efficiently at insertion, storage and removal of lithium cations in and out of the van der Waals spacings between layers. Highly ordered graphite is cheap to manufacture, light weight, abundant, non-toxic, environmentally friendly, has high safety, high capacity, high reversibility, high cyclability and low volume change upon lithium insertion/extraction, and operates at low potentials versus Li+/Li near 0.1-0.2 Volts. The only shortcomings of lithiated carbons are they have high irreversible first charge capacity losses and a double edge sword of low redox potentials versus Li+/Li that can at low temperatures result in lithium metal plating when charging due to slow insertion kinetics at low temperature. These problems can be managed and overcome by improvements in manufacturing processes, materials, electrolytes, additives, coatings and intelligent battery management systems.

Lithium Ion Cathode Materials

Sunday, March 28th, 2010

Lithium ion cathode materials research is one of the most pressing and challenging aspects of lithium ion battery development today, currently holding the most potential for improvement in terms of cell energy density, electrical performance and safety. Lithium ion cells contain many complex material structures and chemical reactions, some wanted and some unwanted, with the most significant bottleneck being the capacity, voltage, stability and cost of the cathode material itself.

The main ingredient that makes a lithium ion cell hazardous and risky of fire or explosion is the highly electronegative cathode material needed for positive electrode function. The cathode consists of a strong oxidizing agent needed to absorb incoming lithium cations from the electrolyte and electrons from the external circuit during discharge. To do this the cathode material contains a high level of oxygen bonded in various structures with metal atoms such as cobalt, nickel, vanadium, chromium, aluminum or manganese or in the form of a metal phosphate such as iron phosphate. The danger of having so many oxygen atoms in the cathode material is that a high temperature failure event could release the oxygen in a vicious fiery reaction or explosive burning with the often volatile hydrocarbon based electrolyte forming a perfect self contained fire triangle consisting of heat, fuel and oxygen!

Another strong oxidizing agent is sulfur which has the same valance configuration as oxygen and can be used in high energy density lithium-sulfur systems as are currently being developed by a few American companies such as Sion Power, Polyplus and Oxis Energy. The main drawback of a sulfur based cathode is that some of the intermediary LiSx compounds are solvent in the electrolyte commonly used in lithium ion cells causing the cathode and electrolyte to deteriorate, plus they often use a high capacity lithium metal anode in order to match the high capacity of the sulfur cathode and must therefore also deal with the uneven plating problems associated with lithium metal anodes. The theoretical energy density of the lithium sulfur system is very high up to 2500 Whr/kg with a practical energy density more in the range of 300-500 Whr/kg.

Synthesis of most common cathode materials are lithium containing in the discharged state and are the only source of lithium within the cell upon construction. After construction the first charge is called the formation charge where the cathode is slowly delithiated to form the Solid Electrolyte Interphase (SEI) layer against the typically carbon anode. The SEI layer is formed from components in the electrolyte and lithium from the cathode. Additional lithium is also irreversibly lost into the carbon anode itself for a total irreversible first charge capacity loss of 20% or more.

Table 1 gives a basic comparison of a number of cathode materials commonly used today. The best cathode materials have both high capacity and high voltage versus lithium to give maximum energy density, as well as low cost, low toxicity and high cycle life.

Table 1

Cathode Material Theoretical Capacity mAhr/g Practical Capacity mAhr/g Voltage versus Lithium Cycle Life Safety Toxicity Cost
Cobalt Oxide 273 140 3.6 Good Poor Med High
NiCo Oxide 240 180 3.5 Good Good Med Med
Layered Mn Oxide 285 160-190 3.8 Very Good Very Good Low Low
Iron Phosphate 170 120 3.2 Very Good Very Good Low Low
Lithium Sulfide 1600 400-600 2.3 Poor Poor Low Low


Cathode Reactions in Aqueous Electrolyte; NiCd, NiMH and Lead Acid Chemistries

Thursday, January 7th, 2010

To properly view the chemical formulas and expressions in this post you may need to download and install the RSC true type font on your computer. See the “Chemistry Font” page in the right sidebar.

The cathode is the positive electrode in an electrochemical cell. During discharge, its job is to absorb incoming electrons from the external electrical circuit by either taking cations (positive ions) in from the electrolyte or by emitting anions (negative ions) out into the electrolyte.

Nickel-cadmium and nickel-metal-hydride cells both use the same positive nickel-oxyhydroxide, NiOOH, cathode material to emit negative hydroxide anions, OHʇ, out into the electrolyte during discharge via the cathode reaction NiOOH + H¿O + eʇ ↓ Ni(OH)¿ + OHʇ. The outgoing OHʇ anions are dissolved into the electrolyte to be re-absorbed through oxidization at the negative anode electrode which consists of pure cadmium in a nickel-cadmium cell, forming cadmium-hydroxide via the anode reaction Cd + 2OHʇ ↓ Cd(OH)¿ + 2eʇ. In the case of a nickel-metal-hydride cell, the anode material is a metal-alloy-hydroxide, MH, that is oxidized back to just a metal-alloy and water via the anode reaction MH + OHʇ ↓ M + H¿O + eʇ.

Lead acid cells use a lead-dioxide, PbO¿, positive cathode material to absorb positive hydrogen cations, , in from the electrolyte and are major factors in the performance and life cycling of the lead acid cell. The lead-dioxide cathode is typically alloyed with 2-10 wt% of antimony or small amounts of calcium and other elements to help strengthen and improve the soft metal’s workability during manufacturing and to help improve its cycle life characteristics, especially for deep cycle applications. During discharge, the PbO¿ cathode is converted to lead-sulfate, PbSOÁ, through a two stage reaction, stage 1) PbO¿ + 4HÄ + 2eʇ ↓ PbÆÄ + 2H¿O, followed by stage 2) PbÆÄ + SOÁÆʇ ↓ PbSOÁ. The 4HÄ component of stage 1 and the SOÁÆʇ component of stage 2 are the products of breaking sulfuric acid molecules, H¿SOÁ, from the electrolyte by the reaction 2(H¿SOÁ) ↓ 4HÄ + 2(SOÁÆʇ). This is why the acidity of the aqueous based electrolyte decreases toward plain water during discharge.

The lead acid anode undergoes a similar two stage reaction during discharge by converting lead into lead-sulfate, a funny thing how the two active components in both the anode and cathode electrode materials both become lead-sulfate, PbSOÁ, during discharge.

A major precaution for lead acid batteries is once discharged, they should never be left in the discharged state for any length of time longer than necessary because the lead-sulfate will slowly change from an amorphous structure to a crystalline structure, and once crystallized, the charge process will have great difficulty reversing the chemical reaction, as once the reversible constituents are locked up the battery loses its capacity to permanent damage. So always recharge a lead acid battery as soon as possible after any significant discharge occasion.

Also, the conversion rate of lead-sulfate from an amorphous structure to a crystalline structure increases with temperature, hence elevated temperature operating environments can be especially detrimental to lead acid type battery life.